HyperGBM: Experiment Visualization in Notebook
This section demonstrates how to visualize a HyperGBM experiment in Jupyter Notebook. With the visualization tool, you could:
check the experiment configurations
check the dataset information
check the processing information
To use these features, an additional package needs to be installed:
pip install hboard-widget
Example
import the required packages
import warnings
warnings.filterwarnings('ignore')

from hypernets.utils import logging

from sklearn.model_selection import train_test_split

from hypergbm import make_experiment
from hypernets.tabular.datasets import dsutils
creat an experiment
df = dsutils.load_bank()
df_train, df_test = train_test_split(df, test_size=0.8, random_state=42)
experiment = make_experiment(df_train, target='y')
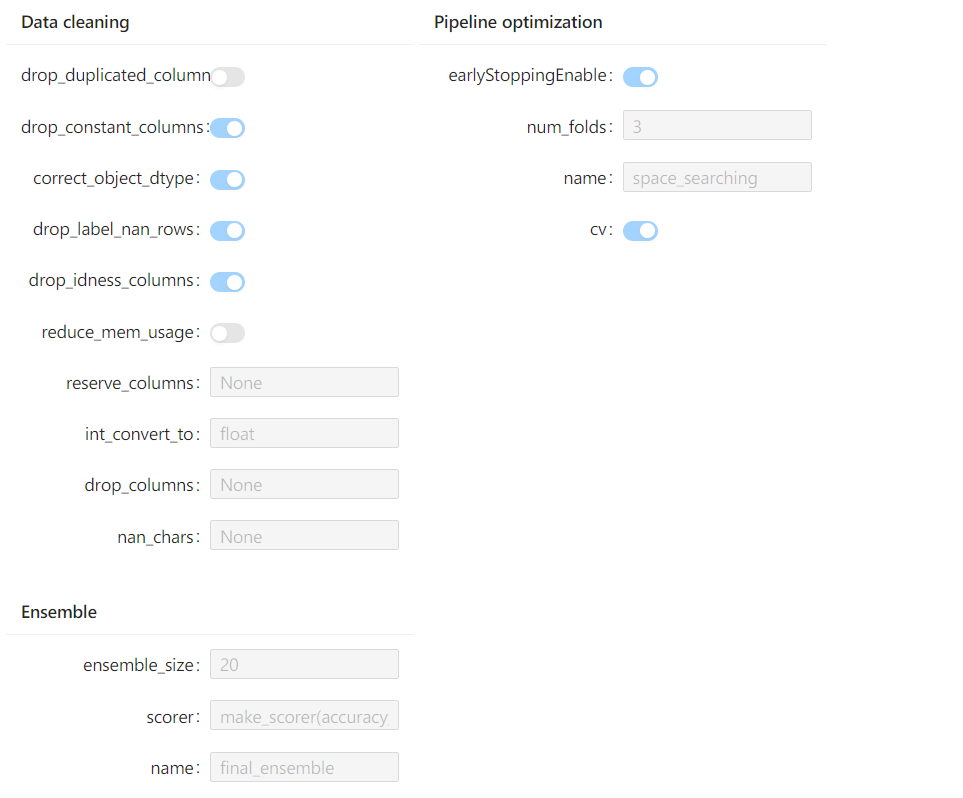
experiment
The experiment configurations is shown as below:
plot the dataset information
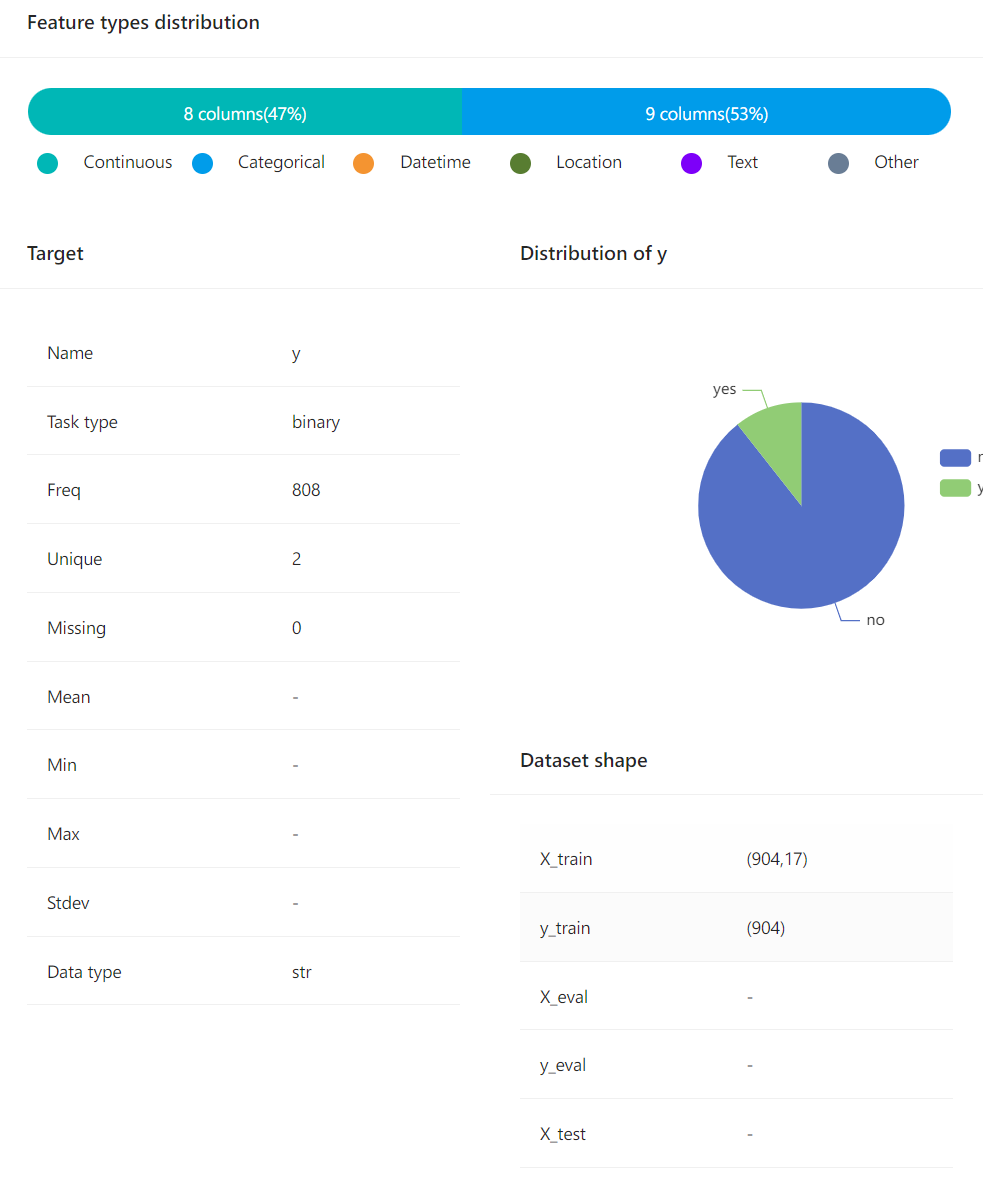
experiment.plot_dataset()
The output information is shown below:
plot the processing information
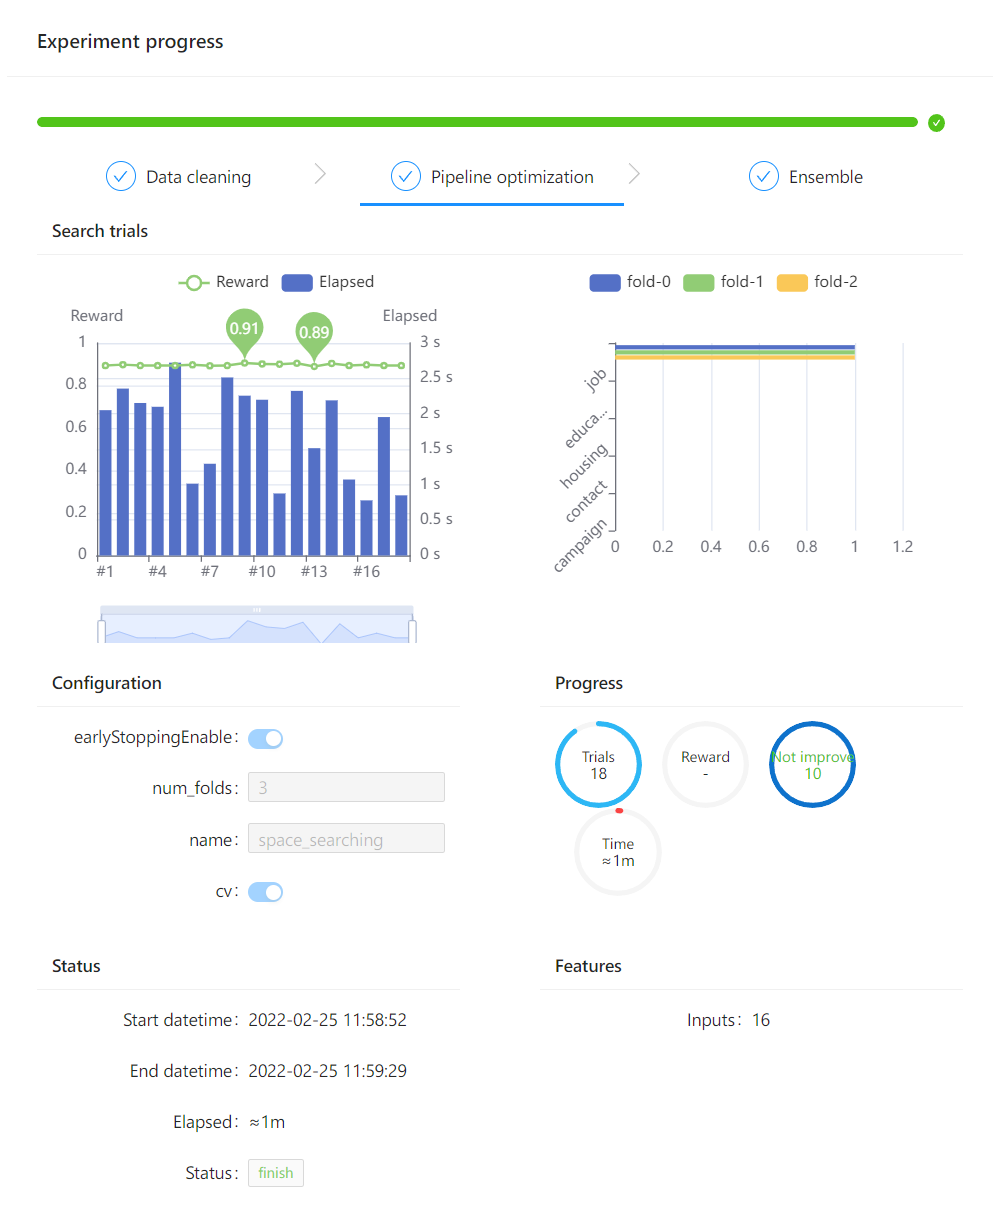
experiment.run(max_trials=20)
The output information is shown below:
Check the Notebook example hypegbm_experiment_notebook_visualization.ipynb